How to Read Your Solar Power Generation Data on the Central Coast
May 21st, 2025 at 06:07 Services Sydney 43 views Reference: 5220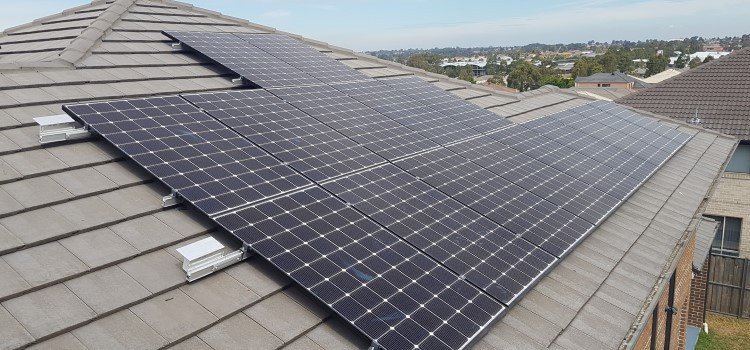

Location: Sydney
Price: Contact us
If you’ve recently installed a home solar system Central Coast, you’re already enjoying the benefits of cleaner energy, lower power bills, and contributing to a sustainable future. However, understanding how to monitor and interpret your solar power generation data is essential to ensure you're getting the most out of your investment.
At Zeneco Energy, we believe in empowering homeowners with the knowledge they need to take full control of their solar energy systems. This guide will walk you through how to read and understand your solar data, what key metrics to look out for, and how to identify if your system is operating efficiently.
Why Monitoring Your Solar Data Matters
Once your home solar system on the Central Coast is installed, it doesn’t just stop at producing electricity. Monitoring allows you to:
-
Track your energy production in real-time or over specific periods
-
Identify peak generation times and adjust usage accordingly
-
Detect faults or underperformance early
-
Maximise return on investment
-
Better understand your energy consumption patterns
Knowing how to read and respond to this data can mean the difference between saving a little and saving a lot.
Accessing Your Solar Generation Data
Most modern solar systems come with an inverter that connects to a monitoring platform—either via a mobile app, web portal, or on-screen display. Depending on your inverter brand (e.g., Fronius, Sungrow, SMA, SolarEdge), you’ll typically be given login access to a user-friendly dashboard.
If Zeneco Energy installed your home solar system on the Central Coast, your system will already be configured with remote monitoring tools. During installation, we guide our clients through the platform so you know exactly where to look and what each figure means.
Key Metrics You Should Understand
Here are the most important data points to track in your solar energy monitoring portal:
1. Solar Power Generation (kWh)
This shows how much electricity your system has produced, usually displayed in:
-
Daily
-
Monthly
-
Yearly
-
Lifetime totals
Compare these figures to your system’s expected output (which Zeneco Energy would have estimated during your consultation) to check if it’s performing correctly.
2. Energy Consumption (kWh)
This tells you how much electricity your household has used. Some systems also show when that energy is being consumed—daytime, evening, or overnight. Aligning your usage with peak solar generation times can dramatically reduce your reliance on grid electricity.
3. Self-Consumption Ratio
This is the percentage of solar energy used directly in your home versus exported to the grid. The higher your self-consumption, the more savings you’ll achieve.
For example:
-
100% self-consumption = full usage of your solar power = maximum savings.
-
50% self-consumption = half of your solar energy exported to the grid (earning less than your usage savings).
4. Exported Energy (kWh)
This refers to the surplus electricity your home solar system on the Central Coast sends back to the grid. While you earn feed-in tariffs for this energy, it’s generally more beneficial to use solar power directly in the home.
5. Grid Import (kWh)
This is the amount of electricity you still need to draw from the grid, usually during nighttime or on overcast days. Lower grid imports indicate better solar optimisation.
Tips for Optimising Solar Usage Based on Your Data
Reading your solar power generation data is just the start. Acting on this data can lead to better efficiency and bigger savings. Here are our top tips:
1. Shift Energy Use to Daylight Hours
Appliances like dishwashers, washing machines, and pool pumps should run during the day when solar generation is at its peak.
2. Use Smart Timers and Automation
Use smart plugs or appliance timers to schedule high-consumption tasks during your solar window.
3. Consider Battery Storage
If your monitoring shows large amounts of exported energy, a battery may be a worthwhile addition. It allows you to store excess solar for evening use, reducing grid reliance even further.
4. Track Seasonal Trends
Energy production can vary with the seasons. Use your portal to compare performance over different months and adjust accordingly.
Investing in Smarter Energy Decisions
Knowledge is power—especially when it comes to solar. The more familiar you are with your system’s data, the more proactive you can be in optimising energy use and cutting costs.
At Zeneco Energy, we’re proud to help Central Coast homeowners take charge of their energy future. Whether you're a new solar user or someone looking to upgrade, understanding your solar data is a key step in becoming energy independent.
Final Thoughts
Reading your solar power generation data might seem technical at first, but with a bit of guidance, it becomes second nature. By understanding key metrics like solar output, self-consumption, grid import, and export levels, you can make smarter choices that benefit both your wallet and the environment.
If you’re considering installing a home solar system Central Coast, or need help interpreting your current system’s data, get in touch with Zeneco Energy. Our local experts are ready to help you make the most of your solar investment.